Correlations
What's actually making you feel like this?
Discover what actually affects your mood, with statistics computed entirely on your device.
The most interesting questions about your data require comparing trackers: does sleep affect mood? Does exercise improve sleep? Does caffeine spike anxiety? Most apps either don't answer these, or answer them by sending your data to a server.
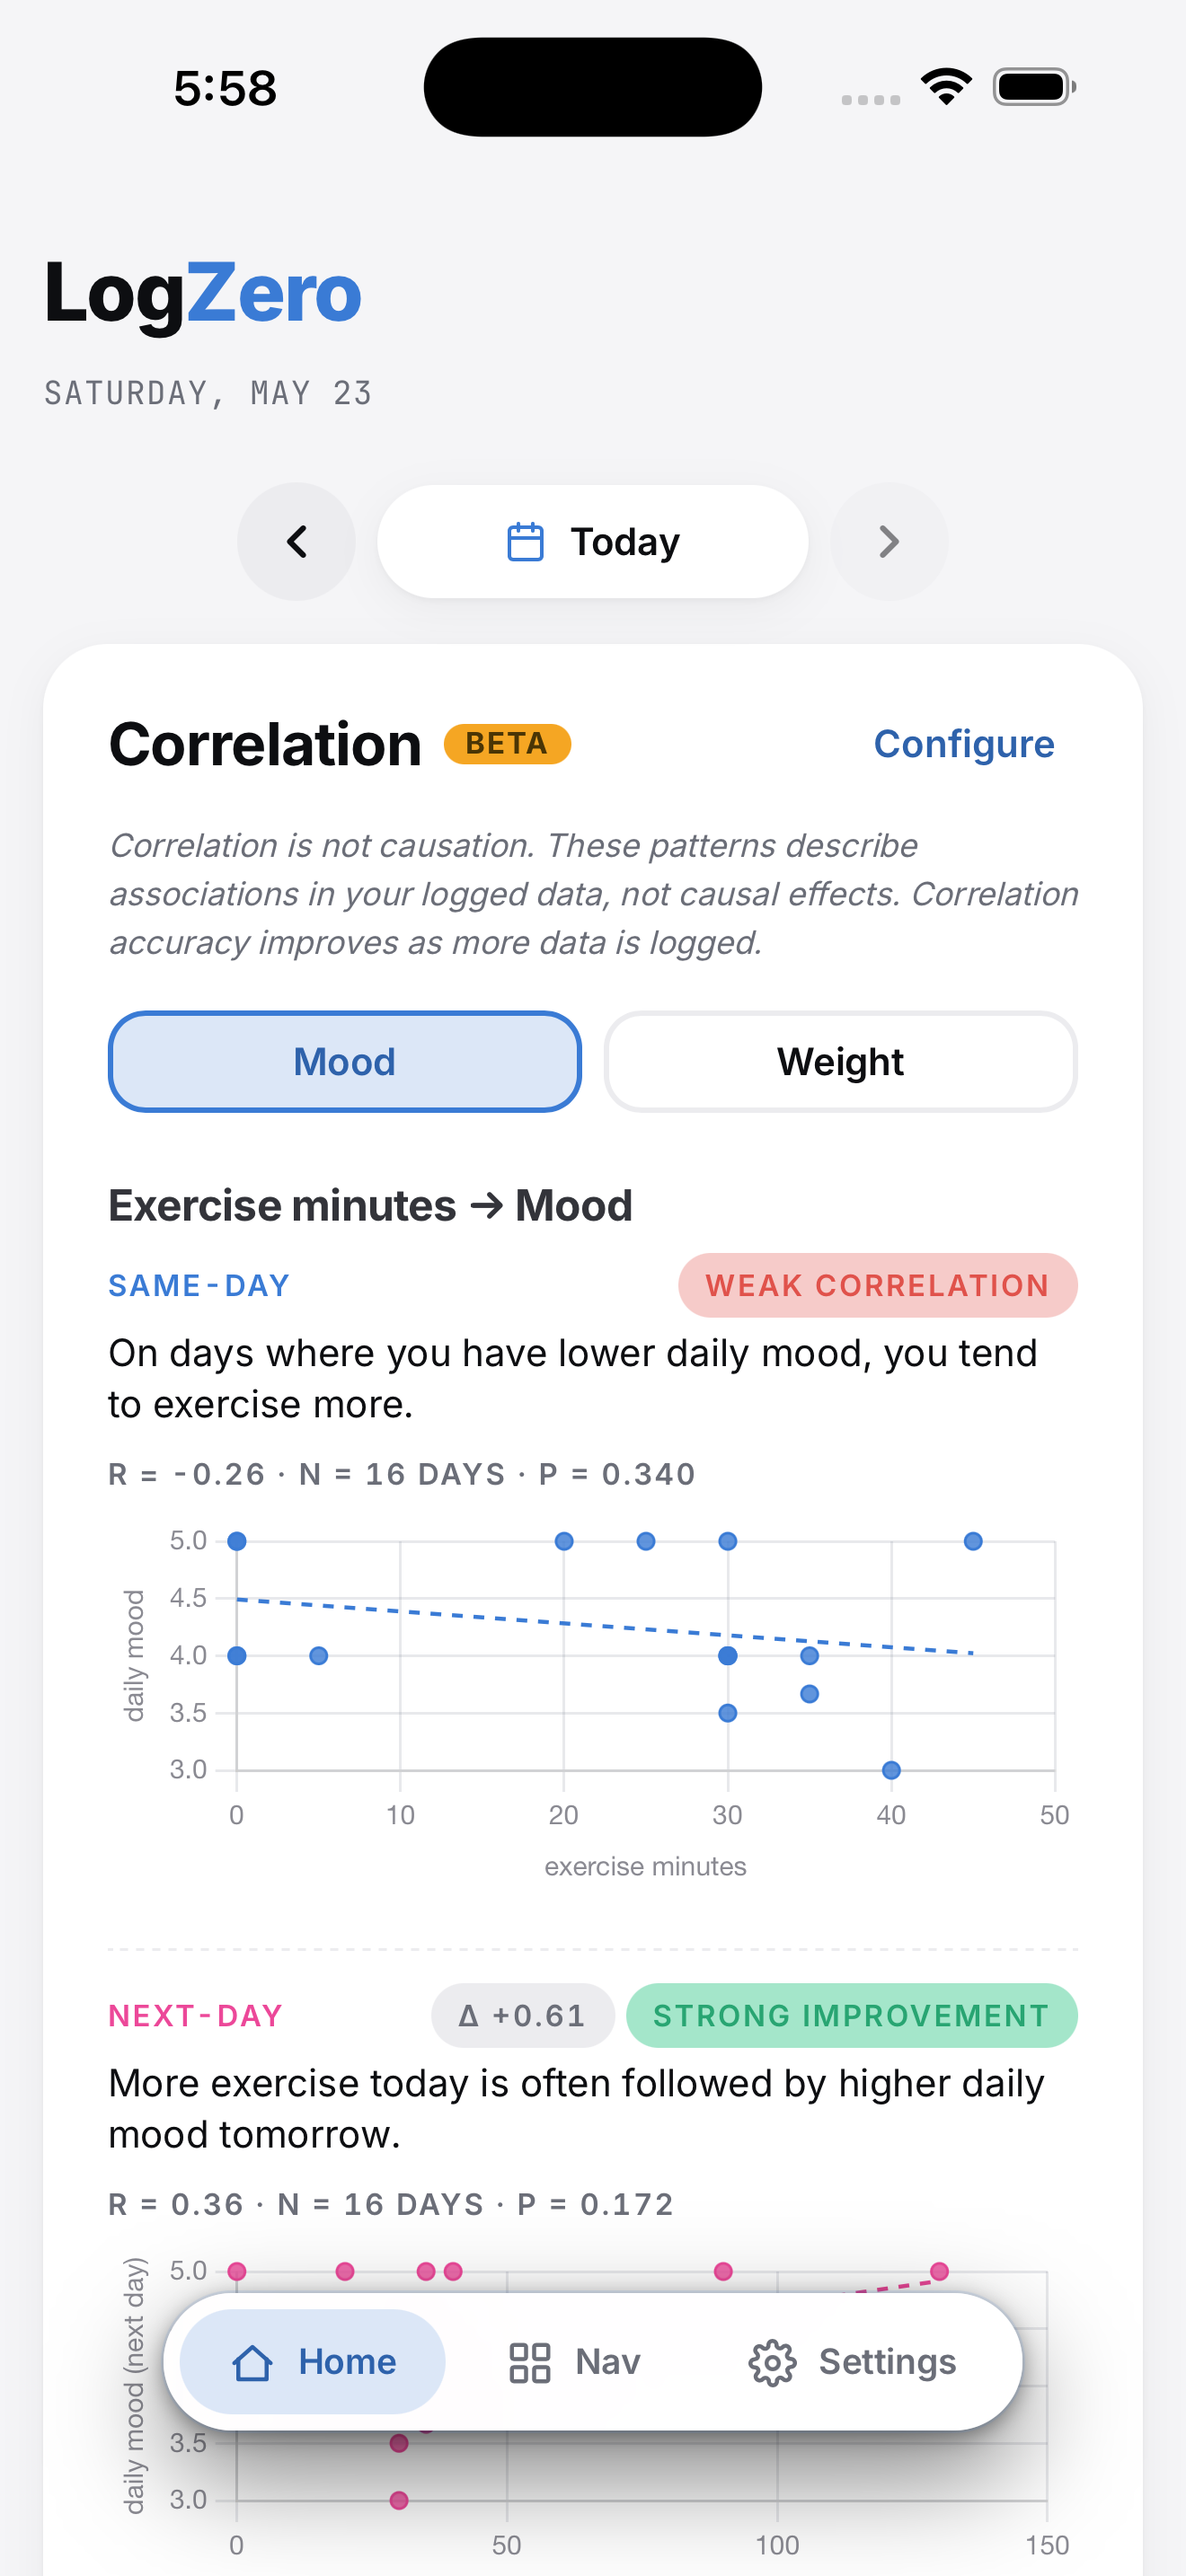
LogZero's Correlation module (Beta) computes Pearson's r between any pair of trackers, on your device, in real time. It looks at same-day correlation and next-day lag, classifies the strength (none / weak / moderate / strong) with confidence levels, and renders a scatter plot you can interpret yourself.
Delta analysis flags improvements and regressions over time. The analysis window is adjustable (14 / 30 / 60 days). Individual correlations can be toggled on or off.
What you get
Capabilities
Two-lag analysis
Same-day and next-day correlations. Patterns that show up the morning after.
Strength + confidence
None / weak / moderate / strong, with statistical confidence levels.
Scatter plots
See the data, not just an aggregated number. Trend line overlaid.
Delta detection
Recent improvement? Recent regression? Flag changes in the relationship.
Adjustable window
14, 30, or 60 days, depending on how much history you have.
100% on-device math
No statistics package phones home. No data ever leaves.
Why this is private
Cross-tracker correlation is exactly the kind of derived insight surveillance economies are built on. LogZero computes it on your phone and shows it only to you. The moat is mathematical, not marketing.
Read the privacy postureRelated
You might also use
Common questions
Common questions about correlations
How does LogZero find correlations without sending data anywhere?
The math runs locally. LogZero computes Pearson's r (a standard statistical correlation coefficient) between any pair of your trackers, on your iPhone, using only the data already on your device. No statistics package phones home. No data ever leaves.
What kinds of patterns can LogZero find?
Same-day relationships (does caffeine spike anxiety today?) and next-day lags (does last night's sleep predict today's mood?). It surfaces strength (none / weak / moderate / strong) with statistical confidence, and renders a scatter plot you can interpret yourself.
How much data do I need before correlations become useful?
As soon as you have about two weeks of overlapping entries between any two trackers, LogZero can compute a meaningful correlation. The analysis window is adjustable (14, 30, or 60 days), so you can start narrow and widen it as your history grows. The longer your history, the higher the statistical confidence the engine assigns — what shows up as a weak signal in week three often firms into a moderate or strong one by month two.
Get LogZero on your iPhone.
No account. No commitment. Your data stays yours.