Dashboard
How am I doing? In five seconds.
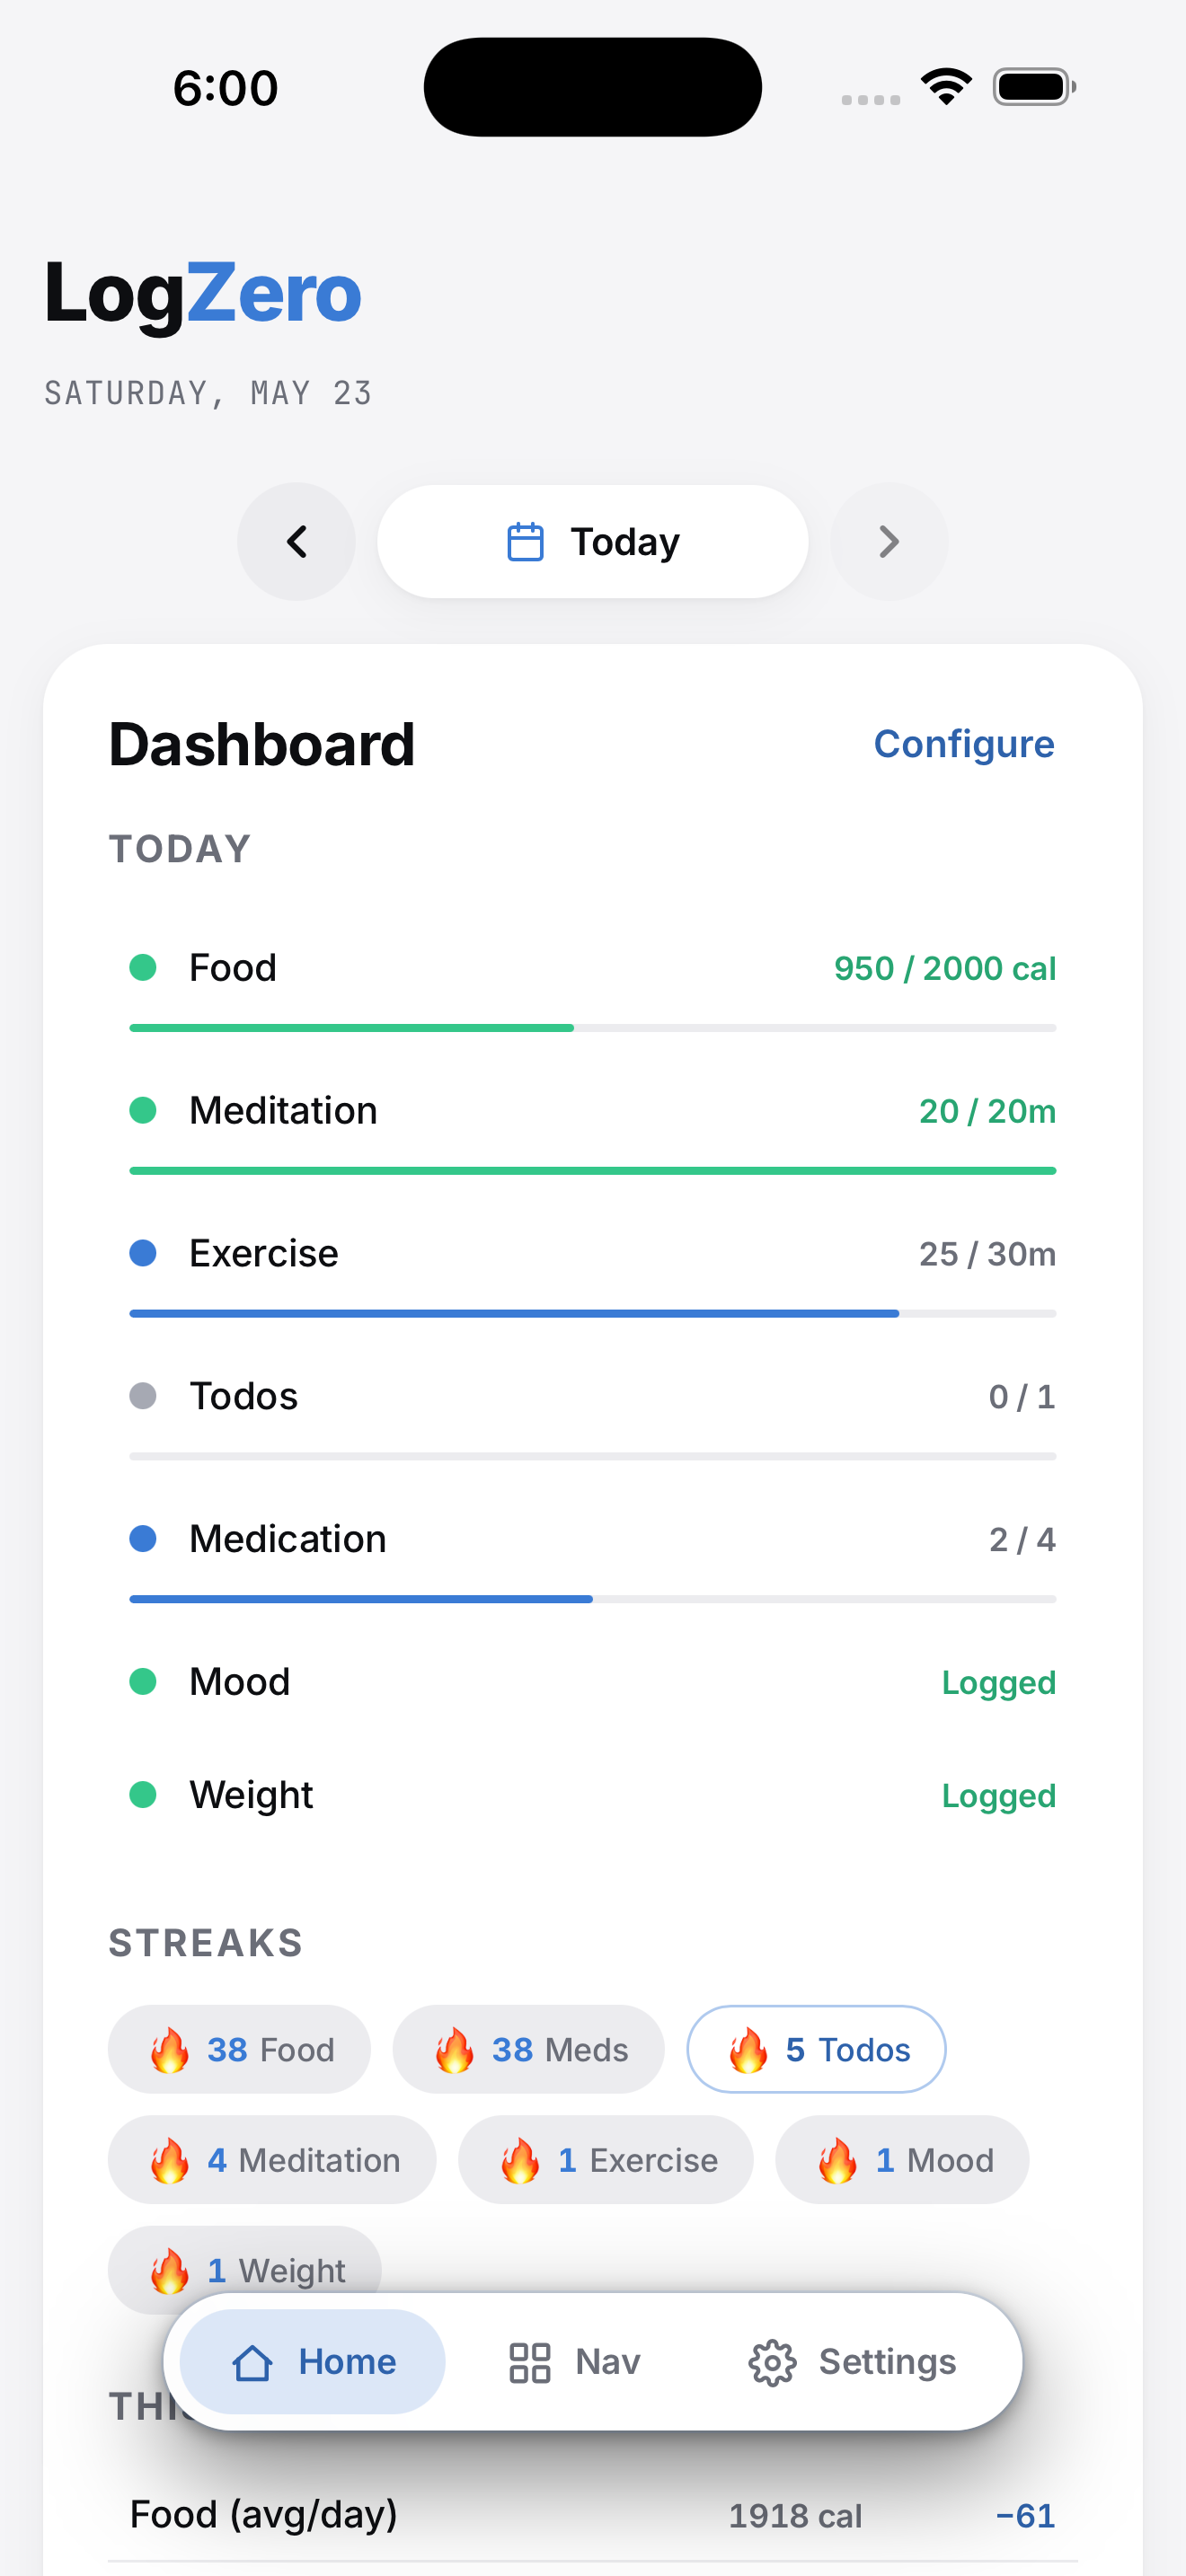
Five widgets. Today, streaks, weekly deltas, one quiet insight, and trend charts. All computed on your phone.
Eight modules is a lot to scroll through. The Dashboard answers "how am I doing today?" in five seconds, without you opening each one at a time.
It shows per-tracker status against your daily targets, streak counts across every tracker that earns one, this-week aggregates with signed deltas vs last week, and a single rule-fired insight per open: a milestone celebration, an at-risk streak warning, or an observation about your week. A collapsible Trend Charts grid sits below for when you want the long view.
Every widget is independently enable/disable and drag-reorderable. If a tracker is off, its row drops out of Today, This Week, and Streaks automatically. The dashboard mirrors your trackers, not a fixed template.
What you get
Capabilities
Today widget
One row per enabled tracker showing a status dot (complete, partial, or over) and progress against the day's target. Tap a row to jump to the tracker.
Streaks widget
Horizontal chips, largest streak first. Zero-streaks are hidden. Tap a chip to jump to its tracker.
This Week widget
Aggregate value per tracker plus a signed delta vs last week, color-coded by direction.
Worth Noticing
A single rule-fired insight per open. Milestone (🎉), at-risk streak (⏳), or observation (💡). Empty when no rule fires. No nag pattern.
Trend Charts
A collapsible grid of mini charts per tracker. Toggle individual charts on or off; the palette rotates so adjacent series stay distinct.
Drag-reorderable
Reorder widgets in Dashboard Settings. The order persists; the surface remembers how you like it.
Why this is private
Aggregated personal data (the cross-tracker view of your day) is the highest-value surface an ad network can buy. LogZero computes the whole dashboard on your iPhone from the local database. No server ever sees your today.
Read the privacy postureRelated
You might also use
Common questions
Common questions about dashboard
What does the LogZero Dashboard show?
Five widgets, top to bottom: Today (per-tracker status against your daily targets), Streaks (live counts across data-bearing trackers), This Week (running totals plus signed delta vs last week), Worth Noticing (a single rule-fired insight per open: a milestone, an at-risk streak, or an observation), and Trend Charts (a collapsible grid of mini charts per tracker). Each widget is independently enable/disable and drag-reorderable.
Is the Dashboard computed in the cloud?
No. Every aggregation is computed on your iPhone from the local database: today's status, streak counts, weekly deltas, the "Worth Noticing" insight, and every chart series. No statistics package phones home. The dashboard you see is yours alone.
Can I rearrange or hide Dashboard widgets?
Yes. Dashboard Settings lets you toggle each widget on or off, drag-reorder them, and toggle individual charts within the Trend Charts grid. Module-level enables and reorders live in the same screen so you configure the whole surface from one place.
Get LogZero on your iPhone.
No account. No commitment. Your data stays yours.